The Art of the Cold Chain Courier
The engineering, the evidence, and the economics of keeping frozen food frozen across South Africa — the field guide we wish someone had handed us on day one.
A frozen food courier is not a transport business with a fridge bolted on. It is three businesses running at once — a machine that holds temperature, an evidence system that proves it held, and a control tower that knows what every stop costs. Most operators build only the first. The other two ambush them through claims, audits, and margin collapse.
We are the only pure-play frozen food courier in South Africa, and we did not get here by being clever. We got here by surviving — four and a half years and more than 1,000,000+ km of learning, often the expensive way, what this work actually demands. This series is that learning, written down.
Everything here sits behind one essay. Before the engineering, before the compliance, before the economics, there is a single question that decides whether an operation lasts: what business are you actually in? Start there — then follow whichever of the three businesses you most need to master.
The three businesses
One operation, three disciplines
Built at the same time, not in sequence. A weakness in any one shows up as a failure in the other two.
1
Engineering
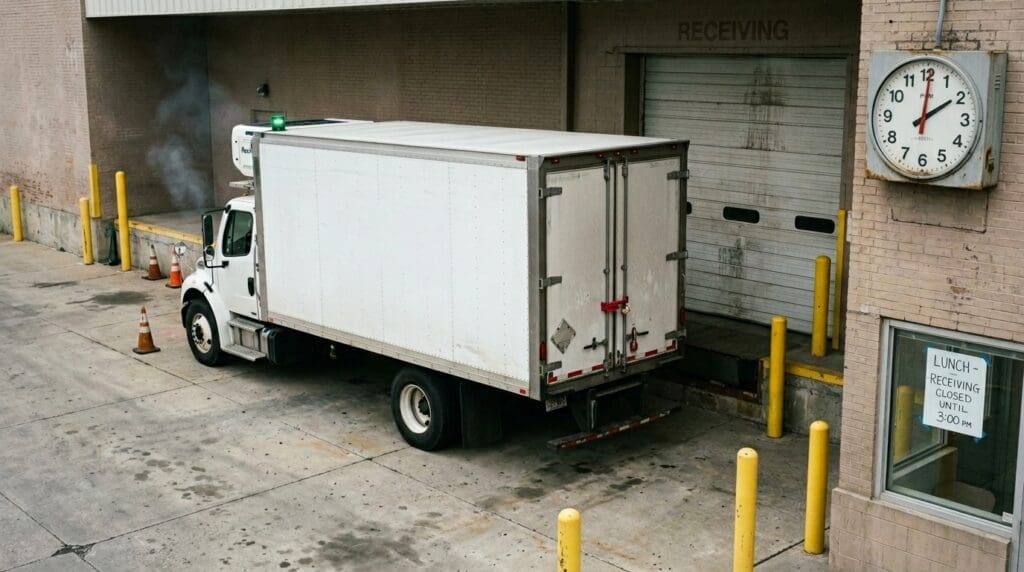
The Machine — equipment that survives courier duty
A courier truck is not a long-haul trailer doing two stops a day. It is a thermal recovery machine doing forty — at altitude, in summer, with the doors opening every sixteen kilometres. The industry sells long-haul specifications for this duty cycle and blames the operator when they fail. The engineering below shows why standard equipment is undersized, how it should be built instead, and what the wrong choice costs across a vehicle’s life.
Why standard equipment fails
Stuck in the Past The High-Altitude Problem The Pre-Cooling Myth Multi-Stop Thermal Load Door-Opening Recovery The Moisture Event The Product-Temperature Question
How it should be built — airflow & condensers
The 90-Degree Delusion Your Evaporator Is Backwards The Ram-Air Misnomer Condensers as Fairings Why Racing Teams Enclose Coolers
How it should be built — the cold-making core
The Constant-Speed Curse The Defrost Dictatorship R448A vs R404a
How it should be built — insulation, body & aerodynamics
The Insulation Crisis The Insulation Materials Guide Thermal Highways Six Surfaces of Failure Radiating Upward (the floor) Ceramic Thermal Coatings The 40mm Miracle (VIP) Aluminium vs Composite Bodies The Aerodynamics Tax The 4-Ton Brick
What it costs over a lifetime
2
Evidence
The Evidence — proving the chain held
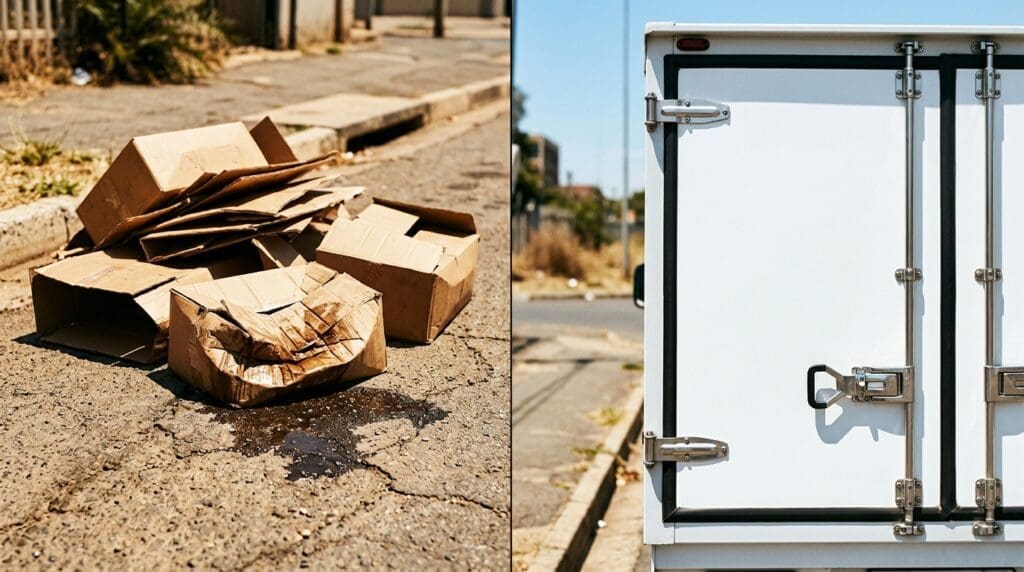
Temperature is not a feeling; it is evidence. The job is not keeping the box cold — it is being able to prove, after the fact, that it stayed cold and was handled correctly at every transfer. That record is not administrative overhead. It is the asset that wins a disputed claim, and the reason we have had one claim in four and a half years. This is the standard we hold, how it is measured, and where the regulations actually sit.
The standard, and how to measure it
The -15°C Standard Measuring Vehicle Temperature -15°C Air, -6°C Product The Dead Zones
Compliance, and what happens when it is disputed
Exceeding R638 & ISO Maintaining the Cold Chain Who Pays for a Thawed Load?
3
Economics
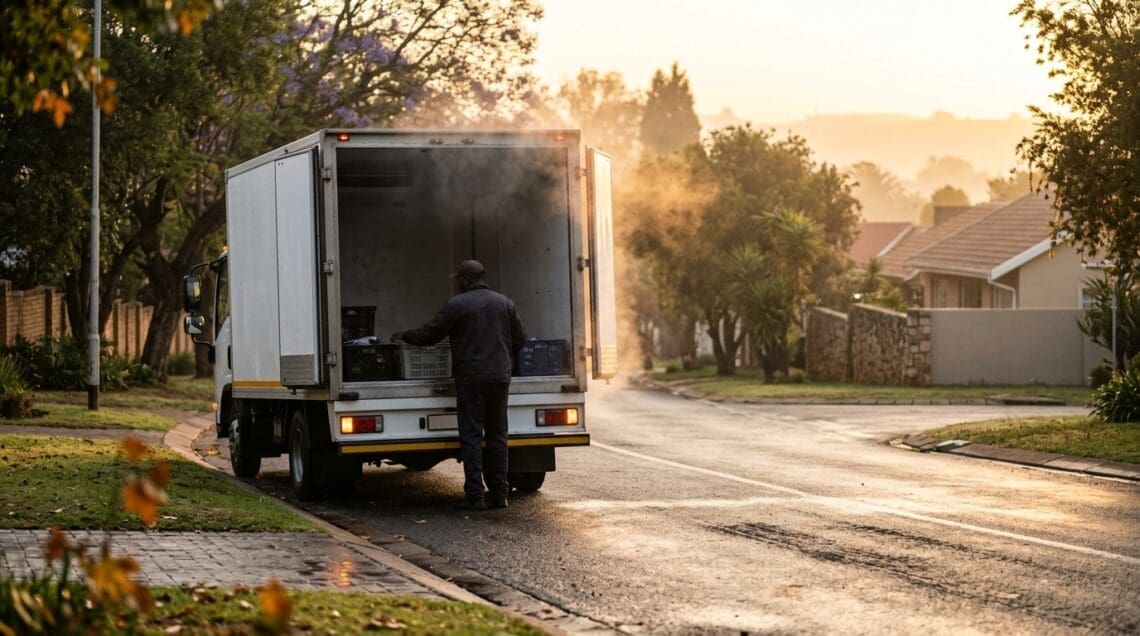
The Control Tower — knowing what every stop costs
You cannot manage what you cannot measure, and instinct only takes a business so far. The control tower is the economics and the data: which diesel market you are actually buying from, why a failed first delivery costs far more than a wasted trip, why food brands that absorb delivery keep failing, and why a “smart fleet” without physics is just a logbook with WiFi.
The economics nobody models
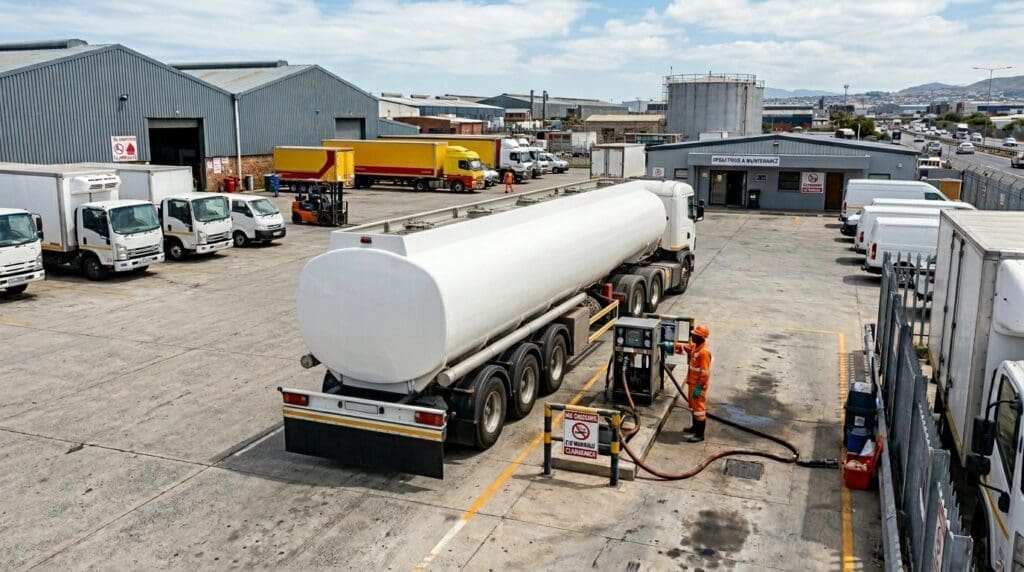
The Two Diesel Markets The Middle East Fuel Crisis The R2,400 Refrigeration Tax The Vertical-Integration Trap Why Uber-Style Delivery Fails The Ice-Pack Delusion
Data over dashboards
The model that does not exist yet
There is no financial reference model for a pure-play frozen food courier anywhere in South Africa. We looked for one when we started; it was not there. The industry does not produce it, because the industry is not made of operators like us — it is general freight companies with a frozen lane among many. So we are building it, bottom-up, from our own operational data. These are the real numbers behind it.
1,000,000+ km
driven across South African routes
~1400 / mo
deliveries across Gauteng & Cape Town
16 km
average distance between stops — a recovery battle, not a cruise
The dimensions a real model has to measure correctly — the ones a per-kilometre cost quietly hides:
Cost per delivery, not per km — a frozen stop pays for both motion and refrigeration; distance alone understates it.
Refrigeration hours as their own cost centre — the compressor runs while the truck is standing still.
The true cost of a failed first delivery — a wasted trip, plus continued cooling, plus a reschedule, plus the thermal hit of a longer route.
The economic value of route density — the gap between a profitable home-delivery round and a depot run that burns three hours in a yard.
Building the reference model
If you run a frozen food courier operation and you are facing the same gap — no benchmark, no model, instinct doing the work of data — we would rather not build it alone. We appear to be the only operator in the country with the data to build it from scratch. There may be value in comparing notes.
The wider series
One of three
This is the second of three series. The Art of Freezing covers the product — the physics that decides whether quality survives before a truck is ever involved. The Art of Selling covers the demand side — getting a frozen brand found, chosen and kept online. Together they make one point: the cold chain and the click chain are the same chain.
A note on tone: many of the articles linked here are written in a deliberately blunt, myth-busting register — they take on the “industry standard” directly, because the physics demands it. This guide is the calm map; the pieces it points to are sharper. The engineering underneath is the same.
Operational figures and engineering claims reflect our own data and were accurate at publication (June 2026). They are offered as orientation, not a quote.