The Art of Freezing Series: Overview · Chapter I: Ice Crystal Physics · Chapter II: Five Elements · Chapter III: Food Matrix · Chapter IV: Speed & Timing · Chapter V: Shape of Battle · Chapter VI: Supply Lines · Chapter VII: Deception
“Sun Tzu understood that the finest army, perfectly equipped and brilliantly trained, could be destroyed on the supply line before it ever reached the battlefield. The same principle applies to frozen food. You can blast freeze perfectly, package flawlessly, and ship in a vehicle that cannot maintain temperature — and watch your product arrive destroyed.”
You have read the previous five chapters of this series. You understand ice crystal formation and why the -1°C to -5°C critical zone must be transited in under 30 minutes. You know the five elements — how water, protein, fat, starch, and dissolved solutes behave at sub-zero temperatures. You have studied composite meal thermal physics, the imperatives of speed and timing, and how packaging geometry determines whether your blast freezer’s output survives the first hour.
Now we reach the chapter that connects the entire series back to why this publication exists.
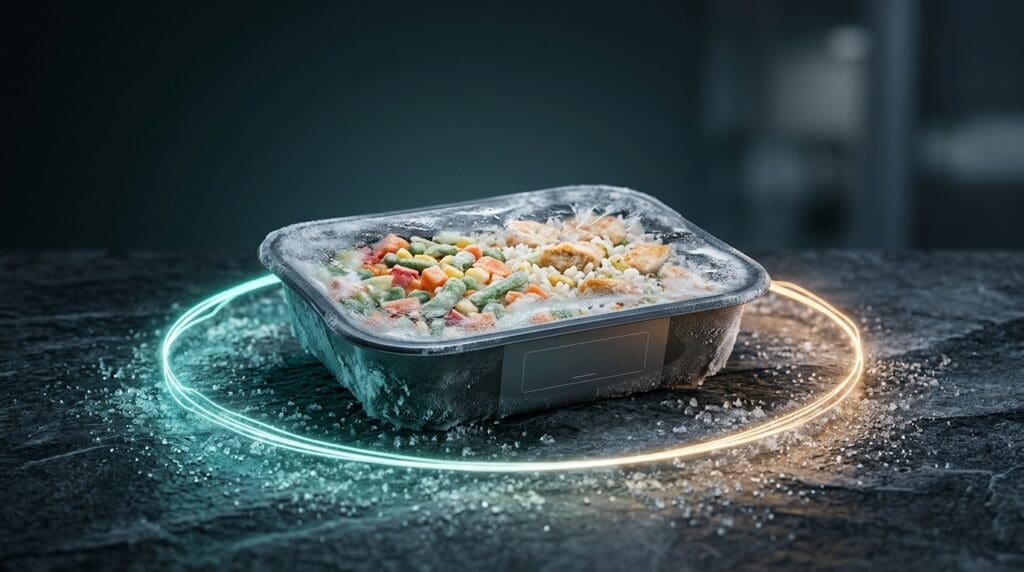
Everything you have learned about the physics of freezing culminates in one moment: the delivery route. Fifteen stops. Forty door openings. Six hours. The culmination of everything your kitchen, your equipment, and your packaging have attempted to preserve — subjected to repeated temperature fluctuations in a vehicle that either maintains -15°C or doesn’t.
After many thousands of kilometres of frozen food delivery across Gauteng and Western Cape, we have direct operational evidence of what happens to frozen products during multi-stop routes. This chapter quantifies it. The physics behind it has a name: recrystallisation, driven by a thermodynamic process called Ostwald ripening. And the gap between operators who understand it and those who don’t is measured in product quality, customer complaints, and the survival or failure of food businesses.
Section 1: Ostwald Ripening — The Complete Physics
You need to understand one fundamental thermodynamic principle before everything else in this chapter makes sense: small ice crystals are thermodynamically unstable. Large ice crystals are thermodynamically stable.
This is not a design flaw. It is a consequence of the relationship between surface area and surface energy. Small crystals have a higher surface-area-to-volume ratio than large crystals. Surface molecules are in a higher energy state than interior molecules — they have unsatisfied chemical bonds and exposure to the surrounding unfrozen phase. The system, following thermodynamic law, seeks to minimise total surface energy. The way it does this is by dissolving small crystals and depositing that water onto larger ones.
This process — small crystals shrinking and dissolving as large crystals grow at their expense — is called Ostwald ripening. In pure water ice, it proceeds slowly at temperatures well below -18°C. In food matrices, which contain dissolved solutes, proteins, fats, and unfrozen water fractions, it proceeds continuously whenever the product is above its glass transition temperature.
The Rate Equation
The LSW (Lifshitz-Slyozov-Wagner) theory describes Ostwald ripening with a deceptively simple equation:
r³(t) − r³(0) = K × t

Where:
  r(t) = mean crystal radius at time t
  r(0) = initial mean crystal radius
  K    = rate constant (temperature-dependent)
  t    = time
The critical variable is K — the rate constant. It is not linear with temperature. It follows an Arrhenius relationship:
K ∝ exp(−Eₐ / RT)

Where:
  Eₐ = activation energy for diffusion through the unfrozen phase
  R  = universal gas constant (8.314 J/mol·K)
  T  = absolute temperature (Kelvin)
The exponential relationship is the critical insight: as temperature rises, the recrystallisation rate increases exponentially, not linearly. A product at -10°C does not experience twice the recrystallisation of a product at -18°C. It experiences approximately 8–12 times the rate, depending on the specific food matrix. A product at -5°C — which is where ice pack systems frequently operate by the end of a multi-stop route — experiences approximately 40 times the recrystallisation rate of a product held at -18°C.
This is why the temperature band matters so profoundly. It is also why every degree above -15°C during transit compounds the damage that occurred during initial freezing.
The Glass Transition Temperature: Where Recrystallisation Stops
There is a temperature below which recrystallisation effectively halts: the glass transition temperature (Tg’) of the food matrix. Below Tg’, the unfrozen phase surrounding ice crystals transitions from a viscous liquid to a glassy, amorphous solid. Molecular mobility essentially stops. Ice crystals cannot migrate, dissolve, or grow because there is no liquid medium through which mass transfer can occur.
For most frozen foods, Tg’ falls between -30°C and -70°C — well below practical commercial frozen storage temperatures. This means that at -18°C, recrystallisation is occurring continuously, just slowly. At -10°C, it is occurring rapidly. At -5°C, it is occurring at near-maximum rate for the food matrix.
Commercial frozen food storage at -18°C represents a practical compromise: slow enough recrystallisation to maintain acceptable quality for months, but not zero recrystallisation. Transit temperature excursions accelerate this background rate dramatically, compressing months of quality deterioration into hours.
Section 2: What Actually Happens on a Multi-Stop Gauteng Route
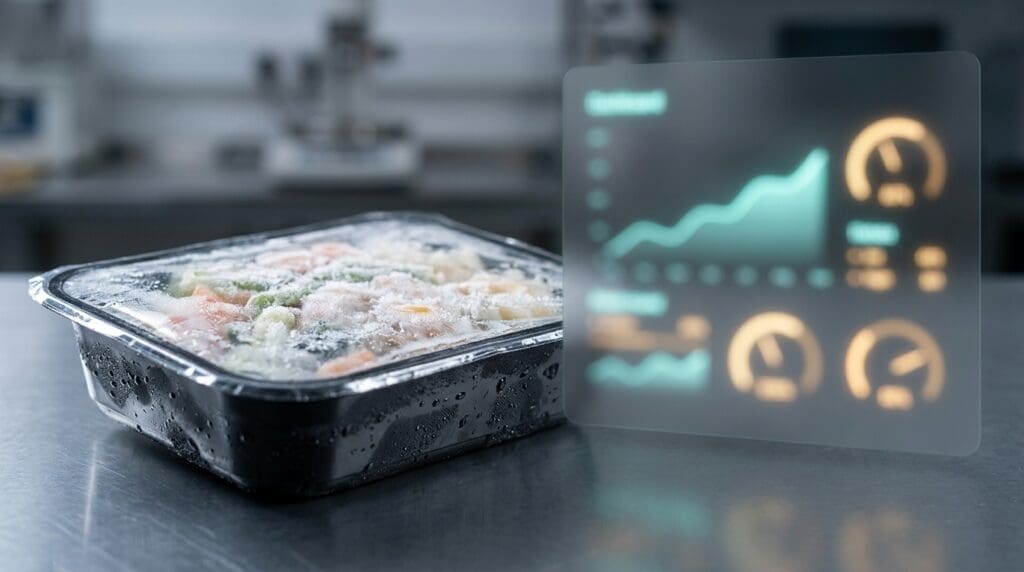
Theory is useful. Operational data is what operators need to make decisions. Here is what our temperature monitoring shows during a typical 15-stop Gauteng delivery route in summer conditions (35°C ambient, 60°C pavement surface).
The chart below shows product core temperature over the course of a 15-stop route, comparing a mechanical refrigeration system maintained at -15°C against a typical ice pack system starting at approximately -15°C.
Several features of this data demand attention:
- Door opening spikes. Every delivery requires the cargo doors to open. Each opening introduces ambient air at 35°C into a -15°C cargo space. In mechanical refrigeration, the compressor responds within 2–4 minutes to restore temperature; product core temperature spikes no more than 1–2°C above -15°C before recovery. With an ice pack system, each door opening accelerates the warming trend — there is no active recovery mechanism.
- The drift curve. Ice pack systems do not maintain temperature. They delay warming. The rate of warming accelerates as the ice pack mass diminishes and as the route extends into peak ambient heat. By stop 8–10 on a typical Gauteng route, product core temperature in an ice pack system crosses -10°C — the point at which recrystallisation becomes aggressive. By the final stops, product is frequently above -5°C, operating in a temperature range that food scientists consider equivalent to slow freezer conditions in reverse.
- The door opening count. The thermal load calculations in our Technical Formulas Reference establish that a 15-stop route involves 30 door openings, each introducing 243 kJ of thermal energy into a 12m³ cargo space at Johannesburg altitude. That is 7,290 kJ of cumulative thermal infiltration — equivalent to running a 2 kW heater for one hour continuously. Mechanical refrigeration absorbs this load. Ice packs absorb some and accumulate the rest as temperature rise.
The Dead Zone and False Sensor Problem
There are two additional thermal hazards on multi-stop routes that amplify the recrystallisation risk beyond what temperature logs typically capture:
First, the dead zone near the cargo doors. Airflow in a refrigerated cargo space is not uniform. The region within 30–50 cm of the door aperture experiences significantly higher temperature fluctuations during door openings than the rest of the cargo space. Products positioned near the doors experience temperature cycling 3–5 times more severe than products positioned near the bulkhead. This is a loading pattern problem with direct quality implications — and one that ice pack systems cannot compensate for.
Second, the air temperature versus product core temperature gap. Temperature monitoring systems that measure air temperature — not product core temperature — systematically underreport the thermal stress experienced by the product. Air temperature recovers quickly after a door opening; product core temperature lags by 10–20 minutes depending on product density and packaging. An operator watching an air temperature sensor may believe temperature excursions are minor and brief. The product knows otherwise.
Section 3: Blast Frozen vs Domestic Frozen in Transit — The Compound Effect
This is where the entire series converges into a single, quantifiable conclusion.
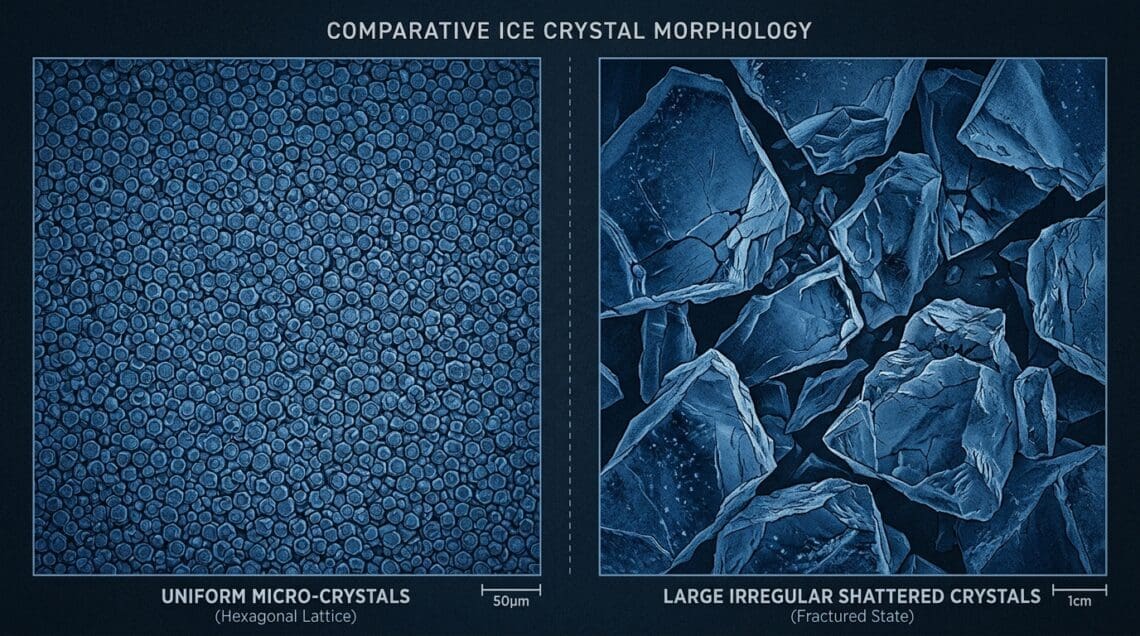
In Chapter I, we established that blast freezing produces ice crystals of 2–15 μm diameter, distributed uniformly within food cells. Domestic freezing produces crystals of 100–1,000 μm, distributed extracellularly, having already caused osmotic cell damage and membrane rupture. The Ostwald ripening rate equation treats these starting conditions very differently.
The r³ term in the LSW equation means that the rate of further crystal growth depends on the cube of the initial crystal radius. A crystal 200 μm in diameter has 64,000 times the volume of a crystal 5 μm in diameter. More critically, the driving force for further Ostwald ripening — the difference in chemical potential between small and large crystals — is proportional to crystal surface curvature. Large crystals have low surface curvature; they are thermodynamically stable anchors around which further growth concentrates.
In practical terms: blast-frozen products with small uniform crystals have low internal driving force for recrystallisation. Domestic-frozen products with large irregular crystals have very high internal driving force. Each temperature excursion during transit provides the activation energy for the system to pursue its thermodynamic minimum — and in domestic-frozen products, that minimum is very far from the initial state.
The visualisation below shows crystal size distribution evolving through a 15-stop route with temperature cycling.
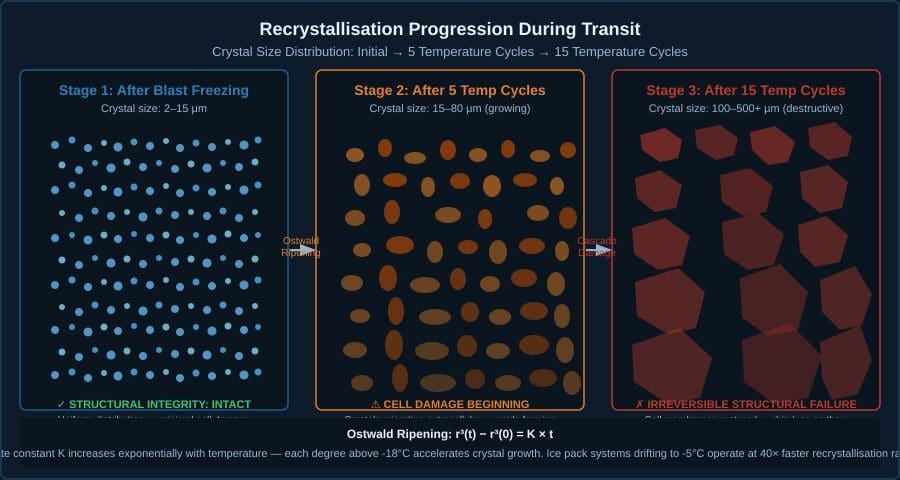
The compound effect is not additive. It is multiplicative. A product that starts transit with large crystals (domestic freezing failure) and then experiences continuous temperature cycling (ice pack transit failure) does not suffer “two problems.” It suffers a compounding cascade where each temperature swing builds on the structural instability created by the previous one. Drip loss accumulates. Cell structure dissolves. Texture degrades irreversibly.
This is why customer complaints about frozen food quality almost never identify the actual cause correctly. The customer thaws the product, observes the pool of liquid and the mushy texture, and blames the most recent event in their experience — the delivery. In reality, the damage was initiated in the kitchen freezer and compounded on every temperature swing during transit. The delivery was the final judge, not the executioner.
Section 4: Ice Pack Systems vs Mechanical Refrigeration — Physics, Not Preference
The comparison between ice pack delivery systems and mechanical refrigeration is frequently framed as a cost debate. This framing is incorrect. It is a physics debate with economic consequences.
Ice pack systems are passive thermal mass. They absorb heat. As they absorb heat, they warm. They have no mechanism for maintaining a target temperature — only for delaying the rate at which the ambient environment overrides the initial cold mass. In South African summer conditions with 35°C ambient temperatures and 60°C pavement radiant loads, this delay is shorter than operators assume and shorter than customers deserve.
The temperature profile of an ice pack system is a continuously rising curve from initial pack temperature to ambient equilibrium. The rate of rise depends on insulation quality, ambient conditions, cargo volume, and door opening frequency. What it does not depend on is the operator’s preference for product to remain frozen. Physics is indifferent to business intentions.
The Recrystallisation Rate Comparison
At -15°C (mechanical refrigeration), the Ostwald ripening rate constant K for a typical frozen protein product is approximately 1 μm³/hour. This means crystal radii grow measurably over days to weeks — acceptable for products stored for months before consumption.
At -10°C (ice pack system at midpoint of a typical route), K increases to approximately 8–12 μm³/hour. Eight to twelve times the recrystallisation rate. Over a 6-hour route, this is equivalent to weeks of storage damage concentrated into hours.
At -5°C (ice pack system near end of route in summer conditions), K reaches approximately 40 μm³/hour. Forty times the rate. In the final two hours of a typical route, more crystal damage occurs than in the previous two months of -18°C storage.
This is not a theoretical concern. Every product delivered by an ice pack system in Gauteng summer conditions arrives with measurably larger ice crystals than it had when it left the producer’s facility. The question is only how much larger — and that depends entirely on how well it was frozen in the first place.
The Compound Damage Matrix
There are four possible combinations of initial freezing quality and transit system. The matrix below maps the cumulative product quality outcome at point of delivery for each combination.
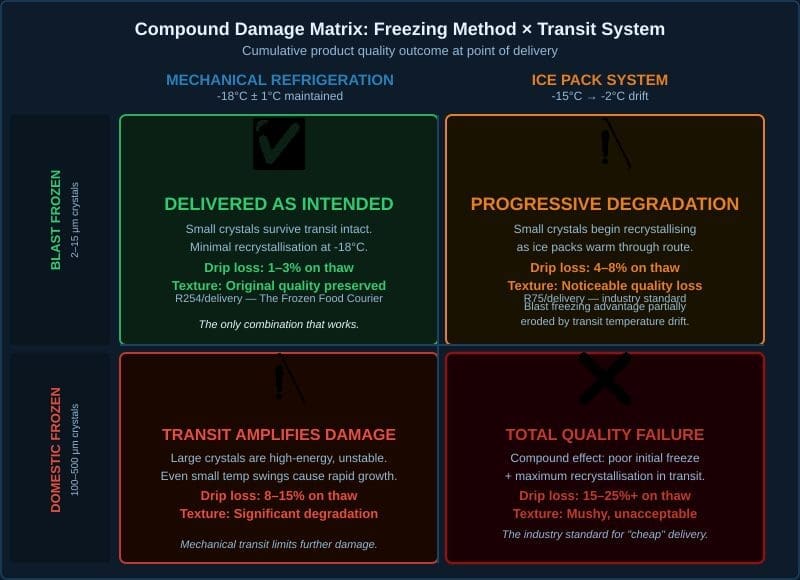
The matrix reveals an uncomfortable truth: there is only one combination that delivers frozen food as the producer intended — blast freezing followed by mechanical refrigeration throughout the supply chain. Every other combination introduces compounding quality loss that the producer cannot control and the customer will experience.
The upper-right quadrant — blast frozen, ice pack transit — is worth particular attention. Producers who invest in blast freezing equipment (R80,000–R250,000) and then use ice pack delivery services have spent significant capital on quality that the supply chain immediately begins destroying. Their product arrives better than domestic-frozen product under ice packs, but measurably worse than the same blast-frozen product under mechanical refrigeration. The investment in quality production is partially wasted by inadequate transit.
Section 5: What Professional Transit Costs and Why
We publish our operating costs. This is deliberate.
The Frozen Food Courier operates at R254 per delivery for mechanical refrigeration at a -15°C operational target with ±2°C door-opening recovery variance, multi-stop routes across Gauteng. Competitors offering ice pack systems operate at approximately R75 per delivery.
The R179 difference per delivery is not margin. It is physics.
Mechanical refrigeration at Johannesburg’s 1,750m altitude requires equipment sized to compensate for a 21% reduction in refrigeration capacity versus sea-level ratings. Our Technical Formulas Reference details the altitude correction calculations: a route requiring 4kW cooling at sea level needs 6.5–7kW specification at Johannesburg elevation. This equipment costs more to purchase, more to fuel, and more to maintain than the passive ice packs used by competitors.
At Johannesburg altitude, our refrigeration systems consume approximately 35% more fuel for equivalent cooling compared to Cape Town sea-level operations, due to combined capacity reduction and COP (Coefficient of Performance) degradation. The altitude penalty alone is approximately R31,500 per vehicle per year in additional fuel costs — costs that ice pack systems do not face because they cannot maintain temperature regardless of altitude.
Beyond equipment and fuel, multi-stop courier refrigeration faces thermal loads that long-haul transport refrigeration sizing assumes do not exist. Our door opening thermal load formula establishes that 30 door openings on a standard Gauteng route introduces 7,290 kJ of thermal energy — equivalent thermal load to continuous ambient exposure for a period far exceeding what manufacturers assume when rating equipment. We size for the actual duty cycle. This costs more. It also works.
The Hidden Cost of the Cheaper Alternative
The R179 per delivery cost difference looks straightforward until you account for what it is purchasing.
Consider a food producer shipping 100 deliveries per month. The visible cost difference is R17,900 per month — R214,800 per year. This appears substantial. But consider the hidden cost calculation on the other side:
If ice pack transit produces an additional 5–10% drip loss versus mechanical refrigeration (conservative, based on recrystallisation rate data), and average product value is R150 per order, then each delivery loses R7.50–R15.00 in actual product mass that becomes liquid waste. At 100 deliveries per month: R750–R1,500/month in product loss alone. Over a year: R9,000–R18,000 in product that was weighed, packed, frozen, and shipped but never eaten.
That calculation does not include customer complaints, refunds, returns, or the compounding effect on repeat purchase rates. A customer who receives a frozen meal that has visibly degraded — pooling liquid on the tray, mushy texture after reheating — has a repurchase rate that approaches zero. The lifetime value of that customer is forfeit. The number of those customers required to justify the R179/delivery saving is uncomfortably small.
You can also read our earlier analysis of why “frozen solid” takes longer than producers assume for related context on how initial freezing decisions cascade through the delivery experience.
The R638 Compliance Dimension
South Africa’s R638 regulations establish -18°C as the required storage temperature for frozen foods. The regulation does not distinguish between storage and transit — frozen food in transit must maintain the same temperature as frozen food in storage. Ice pack systems that allow product to drift above -18°C during transit are not R638 compliant, regardless of whether they are commonly used or commercially convenient.
Compliance here is not merely a regulatory formality. It represents the minimum physics required to prevent the recrystallisation cascade described in this chapter.
Note on transit targets: R638 sets -18°C as the statutory minimum. The emerging scientific consensus — validated by 18 months of Campden BRI commercial trials across 9 product categories — supports -15°C as a sufficient operational transit target, with no measurable compromise to food safety, texture, or nutrition. This is The Frozen Food Courier’s operational standard, and it is the standard we have operated to for eight years. See: The 100-Year Mistake: Why -18°C Was Never Based on Science
Section 6: What This Means for Your Operation
The supply line chapter of this series exists to close the loop. The previous five chapters have shown you how to win the battle in your kitchen. This one shows you why the supply line can undo that victory — and what it takes to preserve it.
If you blast freeze your product: You have done everything physics requires during production. Your crystals are small, uniform, and relatively stable. But they are not invulnerable to Ostwald ripening — they are merely more resistant to it. Every degree above -18°C during transit activates the thermodynamic process that your blast freezer suppressed. The investment in blast freezing is only fully realised when followed by mechanical refrigeration throughout the supply chain.
If you use a domestic freezer for production: Your product enters transit already damaged. Large crystals mean high surface energy, high driving force for Ostwald ripening, and fragile cellular structures that amplify every temperature fluctuation. Mechanical refrigeration in transit limits further damage. Ice pack transit compounds it. Neither fixes the initial problem. The fix is in Chapter IV: Speed and Timing.
Questions to put to your delivery partner:
- What is the product core temperature at the last stop on your typical route — not the air temperature, and not the temperature at departure?
- How many door openings does your route average, and what is your refrigeration system’s recovery time after each opening?
- What is your refrigeration unit’s rated capacity at Johannesburg altitude versus sea-level specification?
- Can you provide continuous temperature monitoring data per delivery, not just departure and arrival checks?
- Are you R638 compliant throughout the route, including at the final delivery?
If the answers are vague, ask for the calculations. If there are no calculations, you have your answer.
Physics does not negotiate. It does not accept marketing claims in lieu of engineering data. Your product’s quality at the customer’s door is determined by the physics of crystallisation, Ostwald ripening, and thermal load management — not by the promises on a competitor’s website or the price point on their invoice.
“The supply line is where battles are decided before they are fought. Every frozen product either arrives as intended or arrives as a thermodynamic compromise. There is no middle ground. Physics does not do partial credit.”
Formulas Referenced in This Article
The calculations supporting this article are documented in our Technical Formulas Reference, including:
- Ostwald Ripening Rate (LSW Theory): r³(t) − r³(0) = K × t
- Recrystallisation Rate Temperature Dependence (Arrhenius): K ∝ exp(−Eₐ/RT)
- Door Opening Heat Infiltration: Q_door = ρ_ambient × V_cargo × Cp_air × (T_ambient − T_cargo) × η_exchange
- Altitude Correction for Refrigeration Capacity: Capacity_altitude = Capacity_sea-level × (1 − 0.12 × Altitude_m/1000)
- COP Degradation at Altitude: COP_altitude = COP_sea-level × (P_altitude / P_sea-level)^0.4
Next in the series: Chapter VII — Deception: What “Flash Frozen” Actually Means (and Why Nobody Can Prove It) — South Africa has no legal definition for “flash frozen,” “quick frozen,” or “snap frozen.” Any producer can use these terms on any product. Chapter VII examines the gap between label claims and engineering reality, and how physics reveals the truth that regulation doesn’t require producers to disclose.
Previous in the series: Chapter V — The Shape of Battle: How Packaging Geometry Controls Freezing Quality
Return to series overview: The Art of Freezing: A Cold Chain Treatise